
OptionTeller Dashboard: From Framework To Finding Your Edge

Motivations Matter
The Dashboard Review
The Analytics Behind The Columns
The OT Relevance Indicator Difference
From Framework To Finding Your Edge
Motivations Matter
For the customer entering an option trade, to the traders who would rather know-than-guess if those trades are bullish, bearish or neutral in conviction, motivations matter. And because the mechanical collating of option trades into aggregate buckets for very short-duration trading has been done - although we would argue not done well for simple humans trying to discern what matters - we set out to create a mission-critical options scanning platform that filters out the signal from the overwhelming noise caused by so many daily option traders chasing ultra-short momentum waves.
Our motivation was not to just present a tool for swing & trend traders to harvest for their research on favorite tickers, but also a way to interpret the tape in a way that totally removes the noise.
And by removing the noise, our tool helps you to be less prone to get sucked into the exhausting path of FOMO (fear of missing out) chasing, where the ultra-short momentum waves can both shake-out and fake-out patient traders and investors.
Don’t get us wrong, there is a place for chasing. At LaDucTrading, we have a Portfolio dedicated to it! And we have partner tools that specialize in intraday option flow.
But our bread-and-butter trading is in the Swing & Trend timeframes. From durable macro trends to sector rotation and thematic baskets that can last months to years.
But it is in the new world of ODTE, where both new & old traders alike can fall victim to the sense of urgency from the ubiqitous and poorly-evaluated aggregate option flow tools - instead of practicing patience.
For these traders/investors, we help you answer the questions around the big motivations from the big customer-level option trades that help you enter or stay in a trade that generates durable wealth - and helps you keep it!
Are these big customer trades building a high-conviction trade or just hedging?
Are they accummulating a real position or just speculating?
We remove the human error and hidden agendas when option tape reading. We apply a consistent lens of filtering and labeling for every customer trade so you can judge for yourself if it matches your analysis and conviction.
Maybe it won’t, but then isn’t that also a useful signal?
The Dashboard Review
The raw data that feeds the dashboard originates from all exchanges in the OPRA feed, but the matching logic, assumptions and relevance indicator are proprietary algos created NOT FROM AI but from decades of experience trading markets and qualifying customer-and-aggregage-level dealer option flow data for institutions.
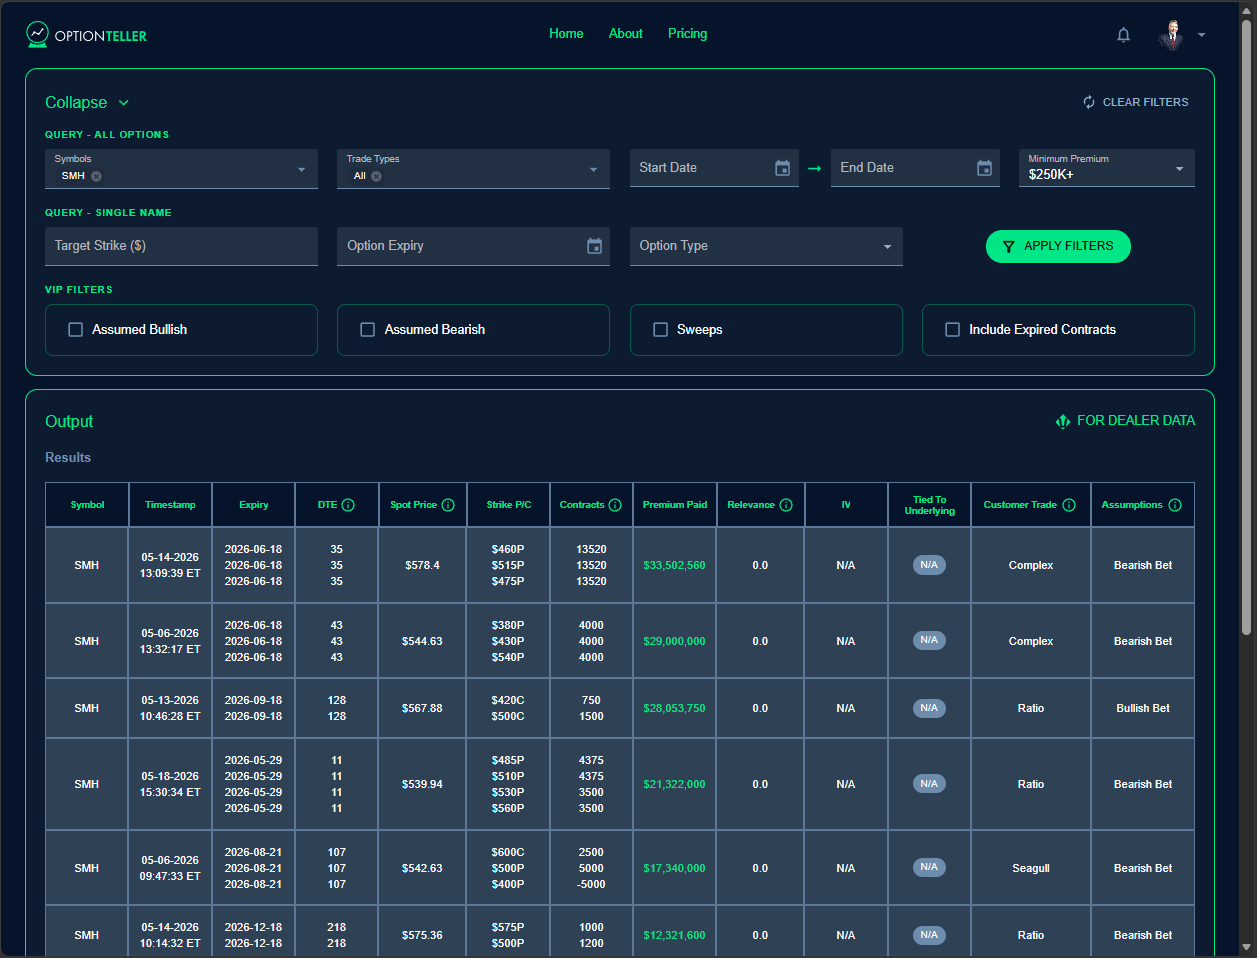
Option Teller Dashboard Review
Introducing Option Teller, our institutional options scanning & research platform to know not guess where large capital is actually positioned.
The Analytics Behind The Columns
Here are the descriptions of the most important Option Teller columns and the analytics behind them.
Customer Trade - Definitions:
This column describes the queried results based on the customer trade type matching.
· BOX - Equal and opposite put and call verticals executed to isolate the borrow rate for the trade. For example, a $90/$100 put credit spread and a $90/$100 call debit spread on the same expiration.
· BUTTERFLY - A 3-leg trade in a +1/-2/+1 ratio in the same expiration where the distance between the short strike and each of the long strikes are equal. For example, a $90/$100/$110 call butterfly with 1 long 90 call, 2 short $100 calls, and 1 long $110 call.
· BUTTERFLY BROKEN WING - A 3-leg trade in a +1/-2/+1 ratio in the same expiration where the distance between the short strike and each of the long strikes are different. For example, a $95/$100/$110 call butterfly with 1 long $95 call, 2 short $100 calls, and 1 long $110 call.
· BUTTERFLY RATIO - A 3-leg trade in a +2/-3/+1 ratio in the same expiration where the distance between the short strike and each of the long strikes are the same. For example, a $90/$100/$110 call butterfly with 2 long $90 calls, 3 short $100 calls, and 1 long $110 call. The ratio of +2/-3/+1 can vary as long as there are as many long options as short options.
· CALENDAR - A 2-leg trade with a short and long strike of the same kind and strike, but different expirations with the short strike expiring sooner. An example would be selling a 20Feb $100 call and buying a 20Mar $100 call.
· COLLAR - This is a credit spread and debit spread of opposite kind with the same delta direction and expiration date. An example would be a sold $90/$95 put vertical and a bought $105/$110 call vertical. These can be applied as single options as well, for instance selling a $110 call and buying a $90 put.
· COMPLEX - These trades do not fall under any of the most common trade types. They are usually complex, multi-leg trades executed on the exchange floor.
· CONDOR - This is a 4-leg trade in a +1/-1/-1/+1 ratio of the same kind in the same expiration. An example would be a long $90 call, a short $95 call, a short $105 call, and a long $110 call.
· CONDOR IRON - This is a 4-leg trade in a +1/-1/-1/+1 ratio of opposite kinds in the same expiration. An example would be a long $90 put, a short $95 put, a short $105 call, and a long $110 call. Iron Condors are more common because OTM options are more liquid than ITM options.
· DIAGONAL - A 2-leg trade with a short and long option of the same kind but different strikes and expirations with the short strike expiring sooner. An example would be selling a 20Feb $95 call and buying a 20Mar $100 call.
· RATIO - This is a 2-leg trade of different numbers of contracts of the same kind and in the same expiration but different strikes. An example would be short a $95 put and long two $85 puts.
· RISK REVERSAL - Involves buying an OTM call and selling an OTM put if bullish or buying an OTM put and selling an OTM call if bearish. This is very similar to a collar but this typically doesn’t have underlying stock associated with it.
· SEAGULL - A 3-leg trade that involves financing a long debit spread with a sold option of the opposite kind on the same expiration. For example, selling an $80 put, buying a $90 call and selling a $100 call.
· STRADDLE - This is a 2-leg trade where a call and put of the same expiration and same strike are bought. An example would be a $100 put bought and a $100 call bought.
· STRANGLE - This is a 2-leg trade where a call and put of the same expiration and different strikes are bought. An example would be a $95 put bought and a $105 call bought.
· SYNTHETIC STOCK - A 2-leg trade that is long an option and short the opposite kind option on the same strike at the same expiration. The P&L profile of this trade mimics a long or short stock. For example, a long $100 call and a short $100 put is a synthetic long position.
· VERTICAL - This is a 2-leg trade where two options in the same expiration and same kind are traded at different strikes, but one is long and the other is short. An example would be buying a $90 put and selling a $95 put.
· PUTS BOUGHT/SOLD – A single leg trade involving puts. Because there are many reasons to buy or sell puts, this trade does not receive an assumption.
· CALLS BOUGHT/SOLD – A single leg trade involving calls. Because there are many reasons to buy or sell calls, this trade does not receive an assumption except sold calls are typically covered calls that are hedges.
Assumptions - Definitions:
This column describes the assumed motivation for the trade based on the customer trade type matching.
· BULLISH/BEARISH BET – These trades are assumed speculative positioning for a directional move.
· BULLISH/BEARISH HEDGING – Whether trade is tied to the underlying or not, these trades are assumed hedges. Example: a “short call and bought put” is a collar which is a hedge that is not bearish but protects a bullish trade. The hedge is considered bullish if the deltas are negative and bearish if the deltas are positive.
· DELTA NEUTRAL – To eliminate direction-specific risk, these assumed trades combine positions to offset price swings in the underlying, allowing traders to profit from volatility (vega), time decay (theta), or income generation.
· ARBITRAGE – To take advantage of mispricing in the option or underlying, these assumed trades (mostly executed by high-frequently traders) capitalize on short-lived price gaps. Example: box trades.
· CLOSING – While we cannot determine if a trade is opened or closed, we can assume some option trade structures are non-sensical unless they are closing an existing position.
Relevance Indicator - Definition:
Relevance scores the positioning on this ticker based on all open interest over the 7-month lookback period from 0–100 to show lowest-to-highest conviction.
· The absolute premium in dollars serves as the primary determinant of trade size and overall relevance, with its absolute value applied so that long and short option positions receive equal weighting.
· The number of contracts adds important context to that premium, since a large contract count at a given premium level typically signals a more aggressive trade positioned further out-of-the-money.
· Placing the absolute difference between spot and strike prices normalizes the contracts figure for moneyness and implied volatility, ensuring that a sizable out-of-the-money trade on a high-volatility meme stock, for example, is not over-weighted relative to a comparable trade on a low-volatility name.
· Days-to-expiration (DTE) tilts away from longer-tenor options with naturally carry higher premiums without reflecting greater conviction or aggressiveness.
· Open interest (OI) accounts for the symbol’s overall activity level, as higher OI makes any individual trade less distinctive.
· The underlying spot price provides final normalization, adjusting for the fact that more expensive stocks inherently generate larger dollar premiums.
· Once all raw significance scores are computed, they are converted into a bounded stochastic-type metric (scaled 1–100) by comparing each trade’s score relative to all others in the universe for that underlying within a 7-month period.
The OT Relevance Indicator Difference
OptionTeller’s innovative relevance metric is designed to show how much conviction the customer has when executing and holding the shown trade relative to the rest of the open trades in the dataset within the chosen time period.
This metric doesn’t exist elsewhere.
The principles of the option pricing models are the same that are used at Volland for their most sophisticated quant & institutional clients - but now, through LaDucTrading, make it available for retail traders in an easy-to-use rating scale of 0-100 (lowest to highest conviction).
Note, this metric is recalculated every day, so you can trust that closed and expired options have been removed - giving the most relevant & timely scoring on this trade every single day.
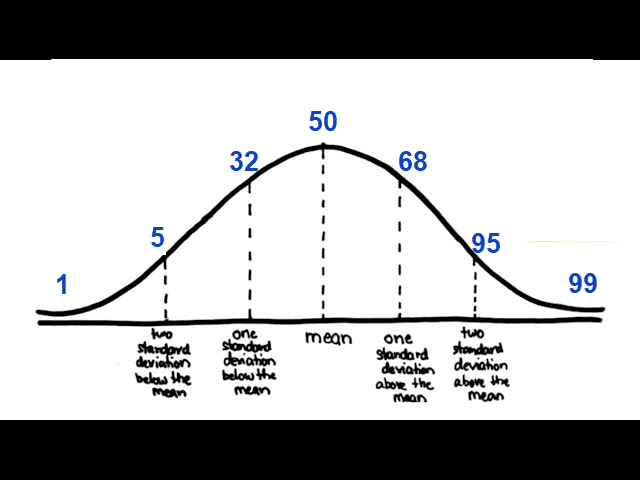
We calculate the relevance metric to signal how strong the customer-level trade is compared to all active trades - and then apply an empirical rule on lognormal distribution to represent the outliers.
To give context:
50 is the mean trade
68 the 1 standard deviation above the mean and 32 would be 1 standard deviation below the mean
95 the 2 standard deviations and 5 would be 2 standard deviations
99 the 3 standard deviations and 1 would be 3 standard deviations
That’s why we built a system that rates relevance to the size of the trade in open interest relative to the period you are tracking (up to 7 months) as context matters to conviction sizing - both the customer trade you are tracking and to your investing capital.
From Framework To Finding Your Edge
What matters in a great options intelligence, research & scanning tool? For us in our work with clients, it was absolutely stripping out the noise, to make sure we don’t miss a trade worth seeing on a stock or ETF that matters to us on a swing & trend timeframe.
That’s why we built a system that:
let’s you see the whole trade - legs and all
labels the customer trade correctly - and admitts when we don’t know
relegates retail trades <50 contracts to the bottom of the dashboard - because we are looking for the the whale positioning afterall
rates relevance to the size of the trade in open interest relative to past 7 months - as context matters to conviction sizing
Then apply your system, analytical tools, and insights - whether macro, technical, quant, fundamental, intermarket or sentiment. But at least you will KNOW where the big, sophisticated capital is being deployed in the positions where you want to follow, or are already invested, or want to take the other side of the trade, or even make your own market!
OptionTeller is a research edge that sharpens your trading process, not buries it in the crashing waves of impatient option day traders.
We hope you enjoy it! And of course, profit from it!!
Let us know by emailing support@option-teller.io with any questions, feedback and testimonials. And pls share with others so we can continue to collect valuable input on how to improve the experience for experienced option traders and investors.